Home / Statistical Tools / Reliability / Uncensored / Reliability: Auto-Fit Uncensored Distribution Fitting
Reliability: Auto-Fit Uncensored Distribution Fitting
From Excel click...
QXL Stat Tools Tab > Reliability > Uncensored > Auto-Fit
Quantum XL can fit both Censored and Uncensored Data. This topic covers uncensored. If your data is censored, see Auto-Fit censored data.
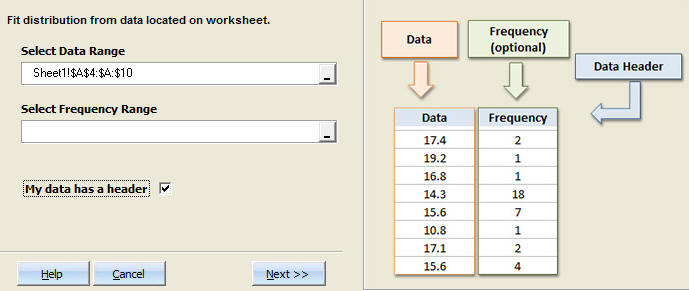
Step #1: Select data source for Analysis.
The data should be in one column.
Step #2
From Excel click...
QXL Stat Tools Tab > Reliability > Uncensored > Auto-Fit
Step #3: Select the data range which contains your data.
Step 4: Choose the distribution(s) to Fit.
Quantum XL will display the fit for each of the distributions with the "best fit" at the top. The quality of the fit can be assessed by either Anderson Darling p-value (AD p-value), Akaike's Information Criteria (AIC) , Bayesian Information Criteria (BIC), or --2*LogLikelihood. To change how the table is sorted, click on the name at the top of the column. (See more information about AD p-value, AIC, BIC, and --2*LogLikelihood.) Select the distribution(s) of interest by clicking on the respective check box in the left column. You may select one or all of the distributions. Enter the specification limits (optional). Note: if you provide specification limits, Quantum XL will calculate the area out of specification. Change the confidence interval for the resulting analysis (optional). If you wish to have a hazard and survivor plot created, check the checkbox (optional). When you're done selecting the desired options, click on the "Create reports for selected distributions" button.
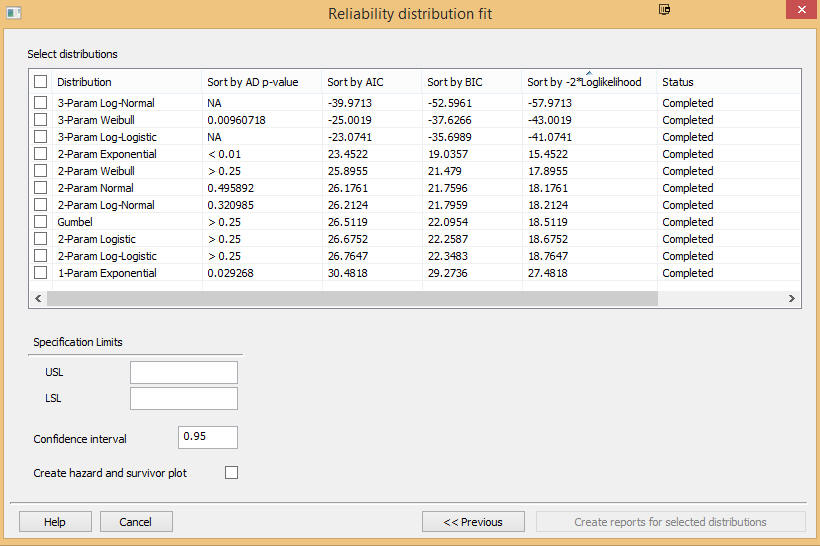
Specification Limits (Optional): If you enter the Upper and/or the Lower Specification Limit, Quantum XL will calculate the associated probabilities in the report.
Confidence Interval: The resulting report will include confidence intervals for estimated parameters. The default value is 95%, but you may enter any value greater than 0 and less than 1.
Create hazard and survivor plot: If you would like hazard and survivor plots, check this box. Note: see Quantum XL's reliability fitting options.
Step 5: Click "Create reports for selected distribution". Quantum XL will create the analysis.
For more information about the analysis, see Understanding Distribution Fit Results.