Home / Statistical Tools / Hypothesis Tests / Tests For Mean / t-Test one sample
One Sample t-Test
From Excel click...
QXL Stat Tools Tab > Hypothesis Tests > Tests for Mean > One sample t-Test
| Test type: | Mean |
|---|---|
| Data: | Quantitative |
| Number of Variables: | 1 |
| Number of Groups: | 1 |
| Assumptions: | One normally distributed sample |
The one sample t-Test is a hypothesis test for the significance of the difference between the population mean and a hypothesized value. It assumes that data comes from a normally distributed sample. If the data is not normally distributed, use 1-Sample Sign instead.
Hypothesis tested:
| H0 : | μ = μ0 |
|---|---|
| H1 : | μ ≠ μ0 |
where μ is the population mean, and μ0 is the hypothesized mean.
Step #1: Select data source for t-Test.
Data for the 'One Sample t-Test' can come from an Excel spreadsheet, SQL data source, or it can be entered manually.
See source data formats and example data for the one sample t-Test.
Step #2: Options.
-
Standard options
- 'Not equal to' option. Select this option to run a two tailed t-test. The null hypothesis is that the population mean and hypothesized mean are equal.
- 'Less Than' option. Select this option to run a lower tailed t-test. The alternative hypothesis is that the population mean is smaller than the hypothesized mean.
- 'Greater Than' option. Select this option to run an upper tailed t-test. The alternative hypothesis is that the population mean is greater than the hypothesized mean.
- 'Hypothesized mean'. The value of the hypothesized Mean.
-
Advanced options
- 'Decision Criteria' option (default = 0.05). The value of the decision criteria (significance or α level).
- 'Charts' options. Display box plot and dot plot along with hypothesis results.
- 'Display mode' option. When the 'Verbose (long)' option is on, Quantum XL will display additional text that explains the hypothesis test results.
Example
-
Run Quantum XL > Hypothesis Tests > Tests for Mean > One Sample t-Test.
-
In the Options dialog, select 'Not equal to' test, and enter 175 for the hypothesized mean.
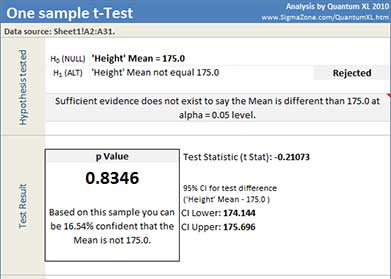
Quantum XL will display t-Test value, p Value, 95% confidence interval for difference between population and hypothesized mean, and dataset statistics.
In this example, the p-Value of 0.8346 is greater than the decision criteria (0.05) so the null hypothesis cannot be rejected. There is not enough evidence to say that the population mean is not equal to 175.
Update
The t-Test is updatable. After you create a t-Test analysis, you can change its data source or add new data to the data source and simply update the analysis.
-
Update: Quantum XL > Statistical Tools > Update Sheet
-
Change settings: Quantum XL > Statistical Tools > Modify Chart/Analysis