Home / Statistical Tools / Analysis Tools / Data Template
Data Template
From Excel click...
QXL Stat Tools Tab > Data Template
Data Template is a convenient way to collect your data in Excel and run Quantum XL analysis.
Although it is similar to group by format data source, it has some advantages:
- It is easier to understand and use.
- One can prepare template for others to enter data.
- Once created, you do not have to worry about selecting data range, data orientation, group by columns.
- One click at Analyze Template is enough to create multiple analysis.
Create Data Template
Select Quantum XL > Data Template.
Step 1
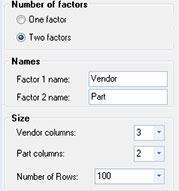
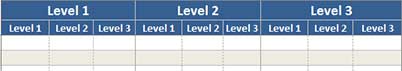
Select number of factors, number of columns for each factors and number of rows for data template. Factor 2 is nested within Factor 1, so Data Template will contain total of ColumnsInFactor1 * ColumnsInFactor2 columns.
Step 2
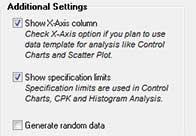
Additional Template settings:
- X-Axis will add additional columns to the left of the data table. It is usually used for categorical data (for example, dates) that is plotted on the chart's X-Axis.
- Specification limits are used in analysis such as CPK and Histogram.
- If Random data option is checked, Quantum XL will fill the template with random data from Uniform Discrete distribution.
Step 3
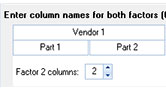
Enter column names for one or both factors. For the two-factor design, you can select how many columns in factor 2 are in each column of factor 1. This is an optional step since you can edit column names directly in the Excel worksheet after Data Template has been created.
Step 4
Select which analysis Quantum XL should run when you click Data Template > Analyze Template. You can also change this setting later in the Data Template worksheet.
Fill Data Template
Before you run the analysis you should fill the data template:
- Use Data, Factor and X-Axis names to describe your data.
- Use USL and LSL to provide specification limits for analysis.
- Enter titles for each data column.
- Enter data you want to analyze and values for X-Axis column.
- Check the checkboxes next to each analysis you want to run.
Run Analysis
Select Quantum XL > Data Template > Analyze Template, and Quantum XL will run all analyses you checked in the Data Template worksheet.
You can also run the analysis in the standard way: with data template active, just click on any statistical tool and Quantum XL will create the report without asking you for a data source, data orientation and grouping columns.
Used Range
Quantum XL will run analysis for the data that you have provided, even if there are fewer or more data rows than you initially defined.
Example: You have created data template with 100 rows.
| X-Axis column | Data Column(s) | Data Analyzed |
|---|---|---|
| 70 | 40 | 40 data points are analyzed. Other 30 X-Axis points are ignored. |
| 40 | 70 | 40 or 70 data points are analyzed, depending on analysis. Empty values are used for missing X-Axis data points, so if an analysis requires non-empty values in X-Axis column, only 40 data points will be analyzed. |
| 110 | 110 | 110 data points are used if they represent a logical extension of the original dataset. This means that if you enter new data just below the last data point, Quantum XL will extend the original dataset to include the newly added data. |