Home / Statistical Tools / Distribution Fit/Calc / Distribution Calculator / Weibull Distribution Calculator
Weibull Distribution Calculator
From Excel click...
QXL Stat Tools Tab > Distribution Fit/Calc > Distribution Fit > 2-Param (3-Param) Weibull
Weibull Distribution is a continuous probability distribution. The Weibull Distribution calculator allows you to calculate the area under the Weibull curve.
To start the calculator, go to Statistical Tools > Distributions > Weibull.
Scale and Shape
The Weibull distribution is defined by the:
- Shape (Alpha) parameter. It must be greater than 0.
- Scale (Beta) parameter. It must be greater than 0.
After you enter the Shape and Scale, Quantum XL will create the Weibull probability curve in a new Excel worksheet.
Calculate area under the curve
In order to calculate the area under the curve you will need to enter at least one cutoff point (Lower or Upper). Depending on which cutoff point you define, Quantum XL can calculate:
-
Probability that X is less than or equal to cutoff point.
-
Probability that X is greater than or equal to cutoff point.
-
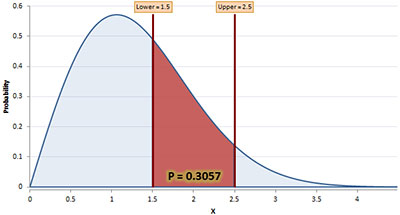
Probability that X is between two cutoff points (you will need to set both Lower and Upper cutoff points).
Select the calculation option from the Probability drop down box.
Calculated probability is graphically represented as the red area under the weibull curve.