Home / Statistical Tools / Additional Tools / Problem Solving / Fishbone Template and Diagram
Fishbone Template and Diagram
From Excel click...
QXL Stat Tools Tab > Problem Solving > Fishbone > Fishbone Template
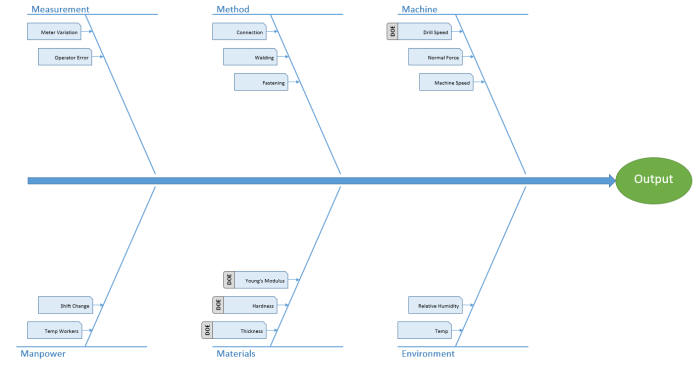
A Fishbone diagram, also called a "Cause-and-Effect" diagram or Ishikawa diagram, is used to identify sources of variation in a product or process. In Quantum XL, start by creating the Fishbone Template and then generate the Fishbone Diagram from the template.
Step #1: Create the Fishbone Template
From Excel click...
QXL Stat Tools Tab > Problem Solving > Fishbone > Fishbone Template
Step #2: Enter the Variable Names and Tags (optional)
The tags can be used to identify variables for special consideration. In the example below, the four variables we intend to experiment with during a designed experiment have been tagged "DOE".
Step 3: Create the Fishbone Diagram from the Template
Select!!! info "From Excel click..." QXL Stat Tools Tab > Problem Solving > Fishbone > Fishbone Diagram from Template
Quantum XL will create the Fishbone Diagram from the data entered into the template.