Home / Statistical Tools / Analysis Tools / Correlation And Covariance / Spearman
Spearman's Correlation Coefficient
From Excel click...
QXL Stat Tools Tab > Analysis Tools > Correlation and Covariance > Spearman's Correlation (Non-Normal)
Calculates the Spearman's Correlation Coefficient between two datasets. Spearman's Correlation Coefficient is based on Pearson's Correlation Coefficient but doesn't make the assumption that the data is Normal.Click here for more information about the calculation.
Step #1: Select data source for Analysis.
Data for Spearman's Correlation Coefficient must come from Excel (not SQL source). Below is an example of two datasets ready for analysis.
Step #2: Press Next or Finish
Quantum XL will calculate Spearman's Correlation Coefficient.
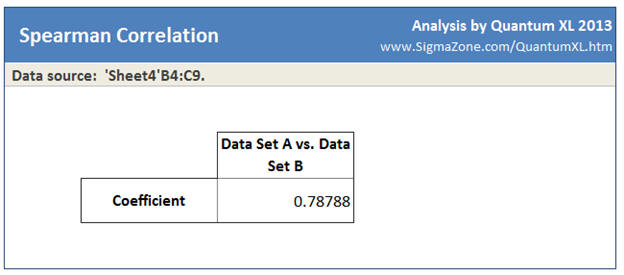
In this case, the Spearman's Correlation Coefficient is 0.78788.
Understanding Spearman's Correlation Coefficient
Spearman's Correlation Coefficient is based on Pearson's Correlation Coefficient except that the data is ranked prior to analysis. With Spearman's, first you rank both datasets, then call Pearson's on the ranked data instead of the raw data. Ranking the data simply means that the data is replaced with its rank order. The smallest data point is replaced with a 1, the next smallest 2, ... For example: in this dataset...
The smallest data point is 1.1, so its rank is 1. The next smallest is 1.5, so its rank is 2. The table below shows the data with the rank.
When Quantum XL runs Spearman's Correlation, both datasets are replaced with their ranks.
Example: The following data ...
... would be replaced with this dataset.
Then the calculation would proceed using Pearson's Correlation Coefficient.