Home / Statistical Tools / Distribution Fit/Calc / Distribution Fit / Understanding the Johnson Transformation
Understanding the Johnson Transformation
The Johnson Transformation is a family of transformations which will normally find an acceptable transformation to normality. Quantum XL uses the algorithm described by Chou (1998) to pick the best member of the Johnson family. The three types of transformations and the parameters are listed in the table below.
Unlike the Box-Cox Transformation, the Johnson Transformation can find transformation of datasets that include negative numbers. If the Box-Cox fails to find a suitable transformation, then the Johnson Transformation may provide a better alternative.
Johnson Families
The Johnson distribution will result in one of the three families. The transformation for the three families is below.
Johnson Fitting
The algorithm to fit the best Johnson Transformation results in evaluating SB, SL, and SU for z=.25 to 1.25 in increments of .01. The z value with the largest Anderson Darling p-Value is chosen as the best fit. See Chou (1998) for more details.
Quantum XL produces a graph with the AD p-value vs. z. The vertical red line represents the "Best z" and therefore the transformation returned by Quantum XL.
Data That Is Already Normal
Before the Johnson Transformation process is started, Quantum XL will calculate the Anderson Darling P-value. If the p-value is greater than .1, then Quantum XL will warn you that the AD failed to reject normality. Normally, you would opt to not use the Johnson Transformation; however, you may "Transform Anyway" if needed.
Failed Transformation
Not all data can be transformed to Normality. Below is a histogram of the life expectancy at birth of female children in various countries. Note that the data is Bimodal.
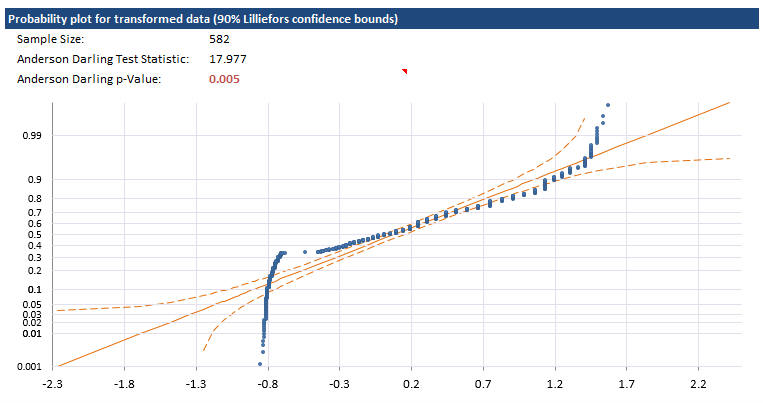
The resulting Johnson Transformation results are below. The note in red just below the title indicates that the Johnson Transformation wasn't able to find a suitable transformation. The best Johnson Transformation still resulted in an Anderson Darling p-value = .005, in which most experimenters would reject normality.
The associated probability plot also indicates the Johnson Transformation wasn't successful.