Home / Statistical Tools / Hypothesis Tests / Tests For Median / Friedman
Friedman test
From Excel click...
QXL Stat Tools Tab > Hypothesis Tests > Tests for Median > Friedman
| Test type: | Median |
|---|---|
| Data: | Quantitative |
| Number of Variables: | 2 |
| Number of Groups: | 2 or more |
| Assumptions: | Each variable must have an equal number of observations (balanced) |
The Friedman test is a hypothesis test used to compare medians when data has been classified by two variables (factors).
Each variable must have an equal number of observations (balanced). The Friedman test does not assume normally distributed data.
Hypothesis tested:
| H0 : | There is no difference between variables (factors). |
|---|---|
| H1 : | There is a difference between variables (factors). |
Step #1: Select data source for the Friedman test.
Data for the Friedman test can come from an Excel spreadsheet or SQL data source.
See source data formats and example data for the Friedman test.
Step #2: Options.
-
'Decision Criteria' option (default = 0.05). The value of the decision criteria (significance or α level).
-
'Display mode' option. When the 'Verbose (long)' option is on, Quantum XL will display additional text that explains hypothesis test results.
Example
-
Open Friedman worksheet.
-
Run Quantum XL > Hypothesis Tests > Tests for Median > Friedman.
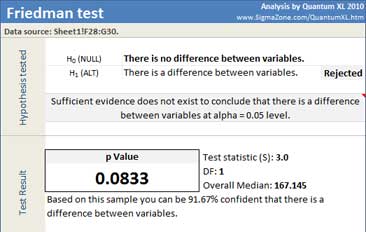
Quantum XL will display test statistics, degrees of freedom, overall median and p Value.
Since the p-Value (0.0833) in this example is greater than the decision criteria (0.05), the null hypothesis cannot be rejected. There is not enough evidence to conclude that there is a difference between variables.
Update
The Friedman test is updatable. After you create the analysis, you can change its data source or add new data to the data source and simply update the analysis.
-
Update: Quantum XL > Statistical Tools > Update Sheet
-
Change settings: Quantum XL > Statistical Tools > Modify Chart/Analysis