Home / Statistical Tools / Analysis Tools / Time Series / Understanding the Moving Average Analysis
Understanding Moving Average
The moving average chart smooths the noise in a time-based data series by averaging the last N points. For example, in the dataset 1, 2, 3, 4, 5, 6, 7 if the moving average length was set to 4, the moving average would be....
| Data | Moving Average |
|---|---|
| 1: | Not available |
| 2: | Not available |
| 3: | Not available |
| 4: | 2.5 (the average of 1,2,3,4) |
| 5: | 3.5 (the average of 2,3,4,5) |
| 6: | 4.5 (the average of 3,4,5,6) |
| 7: | 5.5 (the average of 4,5,6,7) |
When to use a Moving Average Analysis
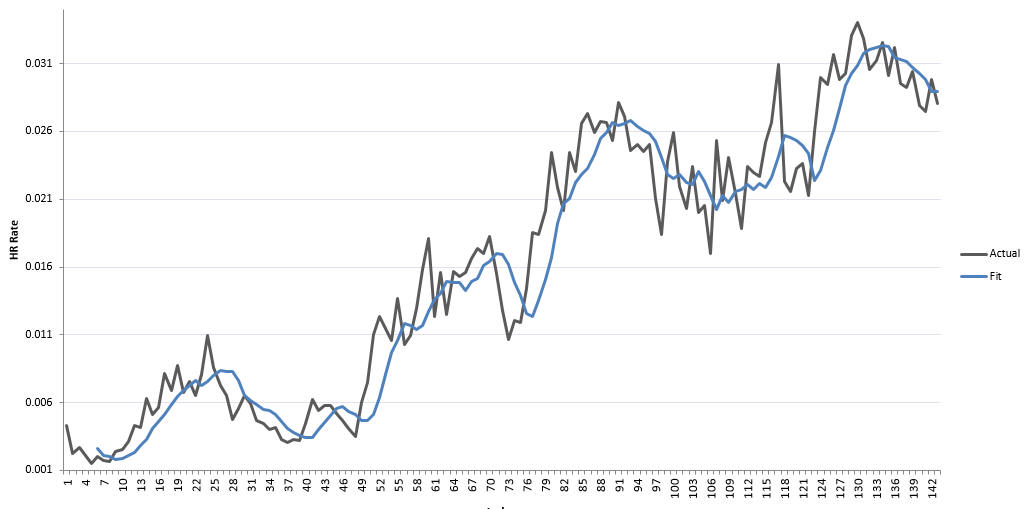
In some cases, data is noisy or has excessive short term variation. The example below uses the Home Run Rate from Major League Baseball. You can download this dataset here. This dataset has the Home Run rate from 1871 to 2013. The Home run rate is calculated as the number of home runs divided by the number of at bats.
If we were to smooth this data using a Moving Range Length = 5 the resulting plot would look like the chart below. Note that the dark brown line represents the Actual (unsmoothed) and the blue line represents the smoothed fit. The smoothed fit line doesn't have the localized variation present in the raw data.
See Also
The data used in the article comes from www.seanlahman.com.