Home / Statistical Tools / Hypothesis Tests / Tests For Mean / Paired t-Test
Paired t-Test
From Excel click...
QXL Stat Tools Tab > Hypothesis Tests > Tests for Mean > Paired t-Test
| Test type: | Mean |
|---|---|
| Data: | Quantitative |
| Number of Variables: | 1 |
| Number of Groups: | 2 |
| Assumptions: | Two dependent, normally distributed samples |
Paired t-Test is a hypothesis test for the significance of the difference between the two populations' means. The Paired t-Test can be used when your data comes in logical pairs. The classic use of the Paired t-Test is to evaluate the before and after of some treatment.
Generally, you can use a Paired t-Test when the following conditions are met:
-
A data point from the first group can only be paired with a data point from the second group.
-
You must have exactly the same number of observations for the first and second groups.
-
The population distribution is normal.
Hypothesis tested:
| H0 : | μd = μ0 |
|---|---|
| H1 : | μd ≠ μ0 |
where μd is the mean of the differences, and μ0 is the hypothesized mean of the differences.
If the data was taken as random samples, use Two Sample t-Test.
Data source for paired t-Test
Data for the paired t-Test can come from an Excel spreadsheet, SQL data source.
See source data formats and example data for the paired t-Test.
Options
-
Standard options
- 'Not equal to' option. Select this option to run a two tailed t-test. The null hypothesis is that the means are equal.
- 'Less Than' option. Select this option to run a lower tailed t-test. The alternative hypothesis is that the mean of the first dataset is smaller than the mean of the second dataset.
- 'Greater Than' option. Select this option to run an upper tailed t-test. The alternative hypothesis is that the mean of the first dataset is greater than the mean of the second dataset.
- 'Difference'. The hypothesized mean of the differences. Default value is 0.
-
Advanced options
- 'Decision Criteria' option (default = 0.05). The value of the decision criteria (significance or α level).
- 'Charts' options. Display box plot and dot plot along with hypothesis results.
- 'Display mode' option. When the 'Verbose (long)' option is on, Quantum XL will display additional text that explains the hypothesis test results.
Example
-
Open paired t-Test worksheet.
-
Run Quantum XL > Hypothesis Tests > Tests for Mean > Paired t-Test.
-
In the Standard Options dialog, select 'Not equal to' test.
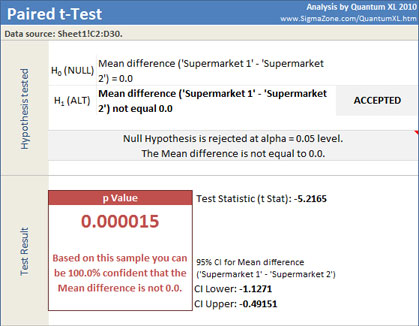
Quantum XL will display t-Test value, p Value, 95% confidence interval for mean of the differences, and dataset statistics.
In this example, p-Value of 0.000015 is less than the decision criteria (0.05) so we can reject the null hypothesis in the favor of alternative. We can draw the conclusion that the mean of the differences is not 0.
Update
Paired t-Test is updatable. After you create a Paired t-Test analysis, you can change its data source or add new data to the data source and simply update the analysis.
-
Update: Quantum XL > Statistical Tools > Update Sheet
-
Change settings: Quantum XL > Statistical Tools > Modify Chart/Analysis