Home / Statistical Tools / Analysis Tools / Capability Analysis Statistics
Capability Analysis Statistics
From Excel click...
QXL Stat Tools Tab > Analysis Tools > Capability Analysis
Quantum XL reports the following statistics below the chart in the Capability Report:
Capability Statistics
Capability Statistics are reported for the Overall (long term) and Potential (short term) Capability. All capability indices assume the process is normally distributed.
- Cp, Pp – Estimates what a centered process would be capable of producing if the mean is centered between the specification limits. Note: Cp is only available if both an LSL and USL are provided.
- Cpl, Ppl – Estimates process capability for processes based on the lower specification limit (LSL) only (for example, strength).
- Cpu, Ppu – Estimates process capability for processes based on an upper specification limit only (for example, concentration).
- Cpk, Ppk – Estimates the process capability based on the current location of the mean. Does not assume the process mean can be centered between the specification limits. If the process mean is outside the spec limits, then Cpk < 0.
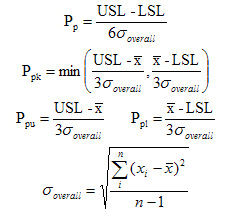
The main difference between Cpk and Ppk is in the calculation of the standard deviation:
| Ppk, Ppu, Ppl, Pp | Cpk, Cpu, Cpl, Cp |
|---|---|
| Overall (or long term) capability uses "Classic" or "Overall" standard deviation | Potential (or short term) capability uses "Within" standard deviation |
 |
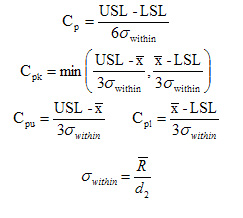 |
Note: This is the general form of the equations and does not reflect changes from using unbiased constants.
Defects per million
Defects per million represents the number of units that are outside the specification limits. If 50% of the units are outside of specification, the dpm = 500,000.
Statistics
Statistics of the process: overall Mean and Standard deviation, within and between Standard deviation, Min and Max value. Goodness of fit test is also reported in this section. Goodness of fit p-Value represents the probability of falsely concluding that the data is not from the Normal distribution. Example: a p-Value of 0.01 means that there is 99% confidence that the data is not from a Normal distribution.
Transformed Stats
This section is reported if you have selected the Box-Cox transformation option. It reports the same statistics as in Statistics section, but for transformed data.