Home / Statistical Tools / Control Charts / Create Control Charts
Create Control Charts
From Excel click...
QXL Stat Tools Tab > Control charts > Select Chart
Step #1
Start appropriate Control Chart from the menu (Quantum XL > Control Charts > ...). See the list of supported control charts.
Step #2
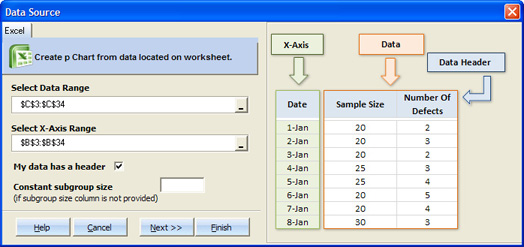
Select data source for the Control Chart. See more information on the Control.
-
Data range represents a data that will be analyzed. This field is mandatory.
-
X-Axis range are the values that will be plotted on the X-Axis of the Control Chart. This field is optional. If it is not provided, Quantum XL will assign ordinal numbers starting from 1 up to maximum number of plotted points.
-
Check 'My data has a header' option if the first row of the selected data for the X-Axis range has the column labels.
-
For attribute Control Charts, you can enter sample size if it is not provided within the data range.
Step #3
Set control charts options.
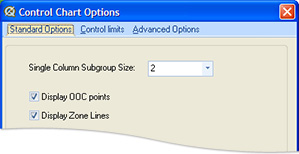 |
Standard options Single column subgroup size. This options is available for XbarR and XbarS charts, when the data is in a single column (or row). Quantum XL will create subgroups from a single data column based on this value. The minimum number of subgroup size is 2, and the maximum is either total number of data points or 100, whichever is smaller. Display OOC points. Controls whether Out-of-Control points are displayed or not. This can be also changed directly on the Control Chart report worksheet. Display Zone Lines. Controls whether Zone Lines are displayed or not. This can be also changed directly on the Control Chart report worksheet. |
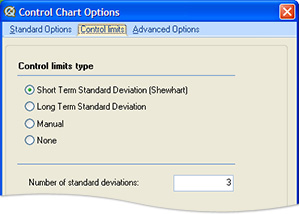 |
Control limits Control Limits type: - Short term standard deviation (Shewhart). This is the default setting. Quantum XL will use short term standard deviation to calculate control limits. - Long term standard deviation. Quantum XL will use overall standard deviation to calculate control limits. - Manual. Quantum XL will not calculate control limits. User must provide upper and lower control limit. - None. Quantum XL will create control chart without control limits. Number of standard deviations. This option is available if control limits are set to Short term or Long term. It tells Quantum XL how many standard deviations the Upper control limit is above the center line (or the Lower control limit is below the center line). The default value is 3. |
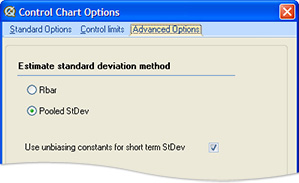 |
Advanced options This option is available for variable control charts, if control limit type is set to Shewhart (short term). Estimate standard deviation method: - For XbarR chart you can choose whether to use Pooled standard deviation or standard deviation estimated with Rbar method. - For XbarS chart you can choose whether to use Pooled standard deviation or standard deviation estimated with Sbar method. - For IMR chart, you can choose between Average Moving Range and Median Moving Range methods. If 'Use unbiasing constants' option is checked, Quantum XL will use unbiasing constants to estimate standard deviation. Otherwise, Quantum XL will use biased estimate of the standard deviation. Moving Range Run Length is available for the IMR charts only. The minimum number is 2, and the maximum is either total number of data points or 100, whichever is smaller. |
Report
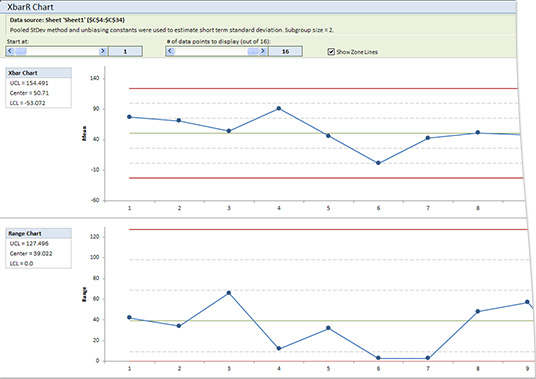
Quantum XL displays the following information on the Control Charts report worksheet:
-
Information about the data source and settings used to create a control chart. This information is located in the report header.
-
Scroll bars that allow the user to customize how many data points are displayed. See Scrolling Control Charts for more information.
-
Check boxes that allow the user to show or hide zone lines and Out-of-Control points.
-
Chart(s) with:
- Control limits (Upper, Center and Lower)
- Zone Lines
- Data points (plotted data depends on a Control Chart type).