Home / Statistical Tools / QFD, FMEA, & Pugh / QFD / Qfd Tutorial / How to create HOQ
How to create HOQ
Step #1: Activate the sheet that you want to be prior to the newly created HOQ. If the sheet is blank, the new HOQ will not have any prior sheet. The prior sheet can be either a PCM or another HOQ.
Step #2: From the menu bar select QXL Stat Tools Tab > QFD > Create new HOQ.
Step #3: Enter the number of rows (customer requirements) and number of columns (Characteristics Critical to Quality -- CTQs). The default number of rows is the Number of columns from the prior sheet + 5. The default number of columns is the Number of columns from prior sheet * 1.5. This allows growth.
Step #4: Select the areas that you want to be displayed on the sheet.
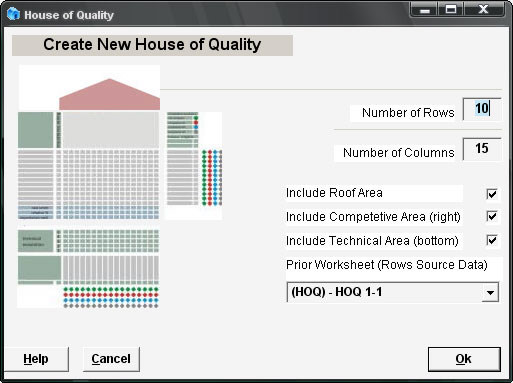
Step #5: Press Ok.
The Wizard will create a new worksheet. The new worksheet contains the HOQ. The main parts of the HOQ are identified on the following picture:
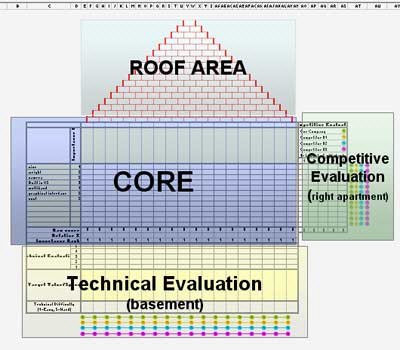
The following description is for the first HOQ. Other HOQs behave the same, only the column and row labels are different.
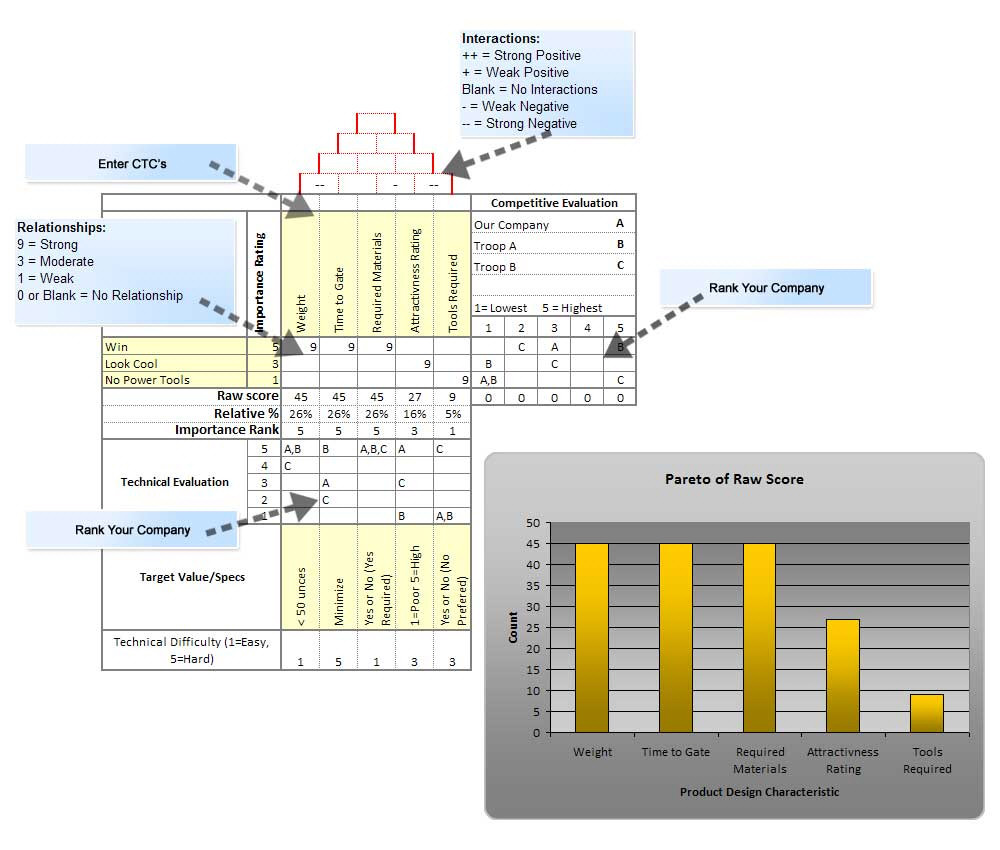
The left side of the CORE area is the customer requirements, while the top row represents Characteristics Critical to Quality (CTQ). Customer requirements and the importance rating column are automatically copied from the previous sheet.
Step #6: Enter CTQs in the top row.
Step #7: Fill in the relationships in the central part of Core area by entering the relationship value in the cell where the relationship exists between customer requirement and CTQ.
Step #8: Fill in the correlations between CTQs in the roof area. Correlations go from strong negative to strong positive.
Step #9: Fill the Competitive Evaluation Area. Rank your company vs. the competition.
Step #10: Fill in the Technical Evaluation Area. Enter the targeted value for each CTQ, and how technically difficult it is to achieve that value. Rank your company.
Step #11: Pareto HOQ. From the QXL Stat Tools Tab, select the option QFD > Pareto HOQ. If you want to override automatic ratings, you can use the Pareto chart to fill the importance rating row. It will be used for the next HOQ.
Following is an example of creating the first HOQ for a pinewood derby race car.