Home / DOE / Charts / Interaction Plots
Interaction Plots
From Excel click...
QXL DOE Tab > Charts > Interaction Plots
Interaction plots can be created from either a DOE Design sheet or a regression model by selecting QXL DOE Tab > Charts > Interaction Plots.
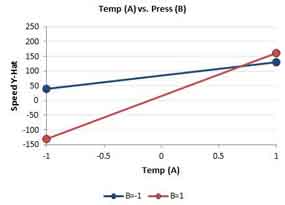
Interactions are graphical representations of the interactions between two variables. If the lines of an interaction plot are not parallel, then there is some degree of interaction. The plot below is the interaction of two quantitative inputs. This interaction is quite strong as the lines actually cross.
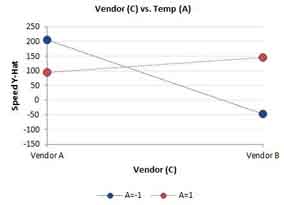
If an input is Qualitative, then lines are still created between the levels but the line is dotted to indicate that values in between are not possible. In the interaction plot below, Vendor is Qualitative but has a strong interaction with Temperature. Vendor can only be "Vendor A" or "Vendor B" so values in between aren't possible.
Source
Interaction plots can be made from a regression model or a DOE Design Sheet. For more information about the differences between these two sources, see the topic Chart Source: Regression Model or Raw Design Data.
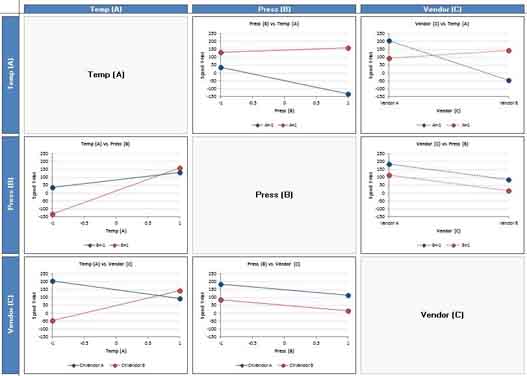
Create Multiple Charts
If you want to make multiple interaction plots at the same time, then use the tab "Create Multiple Charts". Simply check each input you would like to plot. If the source is a regression model, then you can change the set point and range for each variable.
-
Set Point: When plotting two variables, the regression model will need a value for all terms that aren't in the plot. For example, if a model has the terms A, B, and C, when plotting A vs. B, C must be assigned a value. The set point allows you to set this value for other terms when plotting.
-
Range: The default range for each plot is the range of the DOE.
Create Single Charts
Choose the two variables from the drop down box to include in the chart. The Set Point and Range are used the same as in multiple plots (discussed above).