Home / Statistical Tools / QFD, FMEA, & Pugh / FMEA / Create And Modify / Pareto FMEA
Pareto FMEA
From Excel click...
QXL Stat Tools Tab > FMEA > Pareto FMEA
In order to create the FMEA Pareto chart:
Step #1: Select a sheet that contains FMEA Matrix
Step #2: Go to QXL Stat Tools Tab > FMEA > Pareto FMEA > Custom Pareto, or right click on worksheet and select Pareto FMEA option. Pareto Builder will pop up:
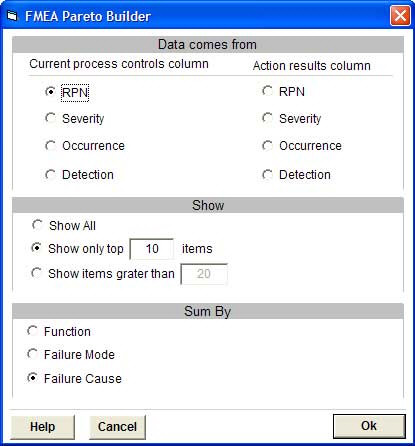
Step #3: Select the column that contains the data that will be used for the Pareto chart. Available columns are RPN, Severity, Occurrence and Detection columns from Current Process and Action groups.
Step #4: Select how many items should be plotted. It is possible to show all items, Top X items or all items greater than X.
Step #5: Select X-axis values. If X-axis values are Failure Causes, each value from the Data Column will be plotted. If X-axis values come from Failure Mode, the Data Column will be summed per Failure Mode. If X-axis labels are FMEA Functions, then the Data Column will be summed per Function (group).