Home / DOE / Charts / Thumbnail Plot
Thumbnail Plot
From Excel click...
QXL DOE Tab > Charts > Thumbnail Plot
Create Thumbnail Plots from either a DOE Design sheet or a regression model by selecting QXL DOE Tab > Charts > Thumbnail Plot.
Source
Thumbnail plots can be made from a regression model or a DOE Design Sheet. For more information about the differences between these two sources, see the topic Chart Source: Regression Model or Raw Design Data.
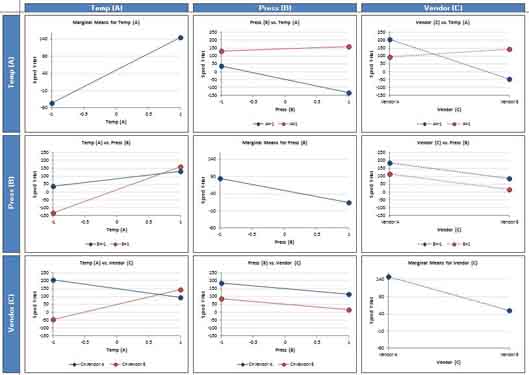
Thumbnail plots are a combination of both interaction and main effects plots. The example below is from a 2-Level design with three factors. The diagonal elements in the square represent the marginal means plots and the off diagonal elements are the interaction plots. Note that the scaling for all of the marginal means plots is the same. Also note that the scaling for the interaction plots is the same. However, the scaling for marginal means plots needs not be the same as interaction plots.
Create Multiple Charts
Check each input you would like to plot. If the source is a regression model, then you can change the set point and range for each variable.
-
Set Point: When plotting two variables the regression model will need a value for all terms that aren't in the plot. For example, if a model has the terms A, B, and C, when plotting A, B and C must be assigned a value. The set point allows you to set this value for other terms when plotting.
-
Range: The default range for each plot is the range of the DOE.