Home / Monte Carlo / Analyzing The Model / Percent Contribution
Percent Contribution
From Excel click...
QXL Monte Carlo Tab > Contribution Tools > Percent Contribution
This feature calculates the contribution of each input to the total variation of the output using Spearman's Rank Correlation Coefficient. The Spearman's coefficient is calculated between each N inputs and the output. The sum of the correlations squared for all N inputs reflects the total. The contribution of an individual input is the coefficient of that input squared divided by the total.
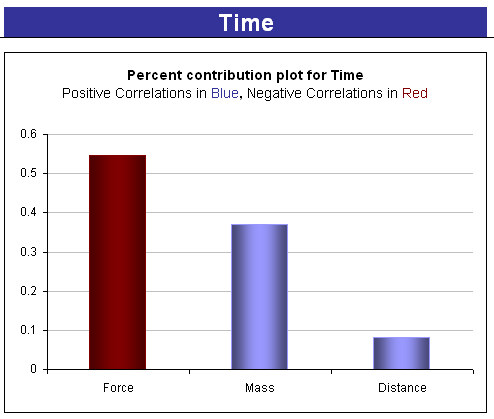
The results are presented in a Pareto and color coded. Bars in blue indicate positive correlations while bars in red indicate negative correlations. In the example below, when Force increases, the output Time decreases (negative correlation). However, when Mass or Distance increase, so does the output Time (positive correlation).
The variation in force accounts for roughly 54% of the total variation in time. The variation in Mass accounts for 37% and the variation in Distance accounts for 9%.
Percent contribution graphs can help you identify which inputs are the major contributors to total variation and therefore would benefit from a variance reduction strategy.