Home / Statistical Tools / Analysis Tools / Dot Plot
Dot Plot
From Excel click...
QXL Stat Tools Tab > Analysis Tools > Dot Plot
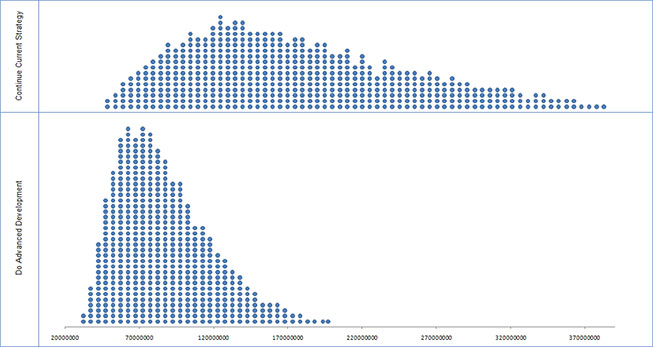
Dot Plot graphically represents individual observations of a dataset. Each observation is represented by a circular dot.
Dots that are plotted vertically represent the frequency of a data point.
Dot Plots are suitable for small datasets, and they are useful for displaying data clusters, gaps, and outliers. For larger datasets, histograms or box plot might be more appropriate tools.
Note
Quantum XL will try to display all observations from a dataset on available viewport. If that is not possible, a single dot might represent multiple observations.
Step #1: Select data source for Dot Plot.
Data for the Dot Plot analysis can come from an Excel spreadsheet or SQL data source. See source data formats.
If your dataset has more than one column, Quantum XL will create charts for each column and align them vertically..
Result
Update
Dot Plot is updatable. After you create a Dot Plot analysis, you can change its data source or add new data to the data source and simply update the chart.
- Update Dot Plot: Quantum XL > Statistical Tools > Update Sheet
- Change data source: Quantum XL > Statistical Tools > Change data source