Home / Monte Carlo / Analyzing The Model / Surface and Contour Plots
Surface and Contour Plots
From Excel click...
QXL Monte Carlo Tab > Contribution Tools > Surface and contour plot
Quantum XL can generate surface, contour and interaction plots for any model. The plots are deterministic (do not include variation) and can give insight into how complex systems function.
Step #1: Select plots, inputs and outputs
The first dialog gives you the opportunity to select which inputs and outputs will be used and which charts will be created.
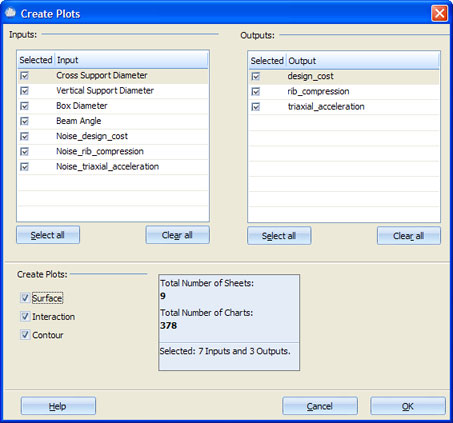
At least two inputs, one output and one chart must be selected. Total number of created sheets is equal to the number of selected outputs * the number of plot types (Surface, Interaction, Contour). For each sheet there will be N*(N-1) charts, where N is number of selected inputs. Please note that if there is a large number of charts, it can slow Excel down significantly, or even make it throw an 'Out Of Memory' error message.
Step #2: Define the lows and highs for the input variable(s)
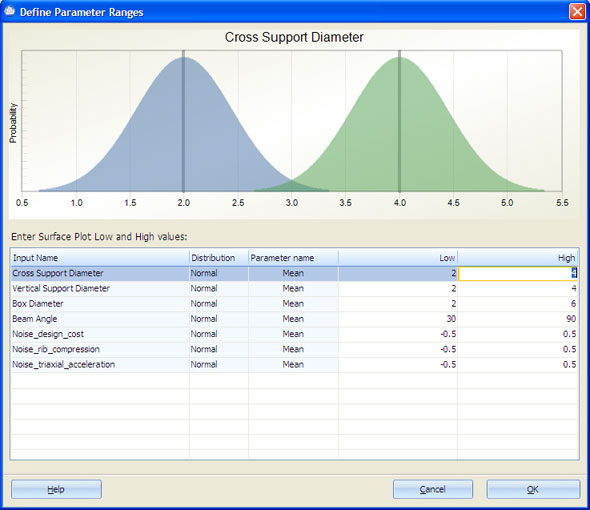
Enter low and high values for distribution-specific parameters. See Supported Distributions for more information.