Home / Monte Carlo / Model Building / Define Inputs and Outputs
Free Form Model Building (Define Inputs and Outputs)
Quantum XL supports several forms of model building including Free Form Model Building, Create Design (IPO) Sheets, Import from DOE Pro, Merge Designs, Visual Merge and Convert to Visual. This help topic discusses Free Form Model Building.
The process of building a free form model involves creating the model, marking inputs, and marking outputs.
Tip
I/O Manager provides a flexible way to maintain inputs and outputs in a workbook.
Creating the Model
The process of creating the model involves entering the equations into Excel to support the model you are working on. An example of a simple model is below. The model calculates the distance traveled by a car based upon the speed of the car and the time the car travels.
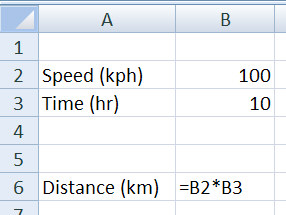
Your model might be a complex engineering calculation or a financial model with multiple rows and columns.
Marking Inputs
After you have created the model, you can give your model's inputs variation by marking them as Inputs. To mark them as inputs, you can 1) right click on the cell and select "Mark Inputs", or 2) select Mark Input from the shortcut bar ( ). You will then be prompted with the following options.
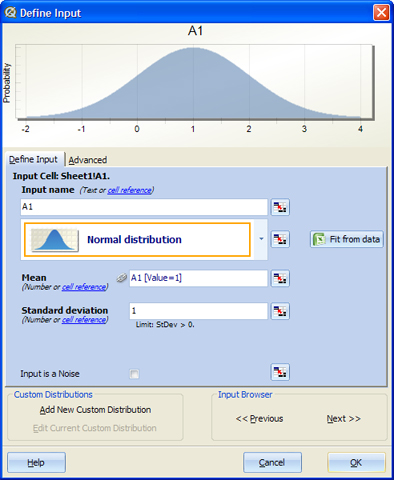
There are several fields which control how the input should be simulated. You can either directly enter the values or you can use the link button  (or cell reference hyperlink) to link the value to a cell. The link can be absolute or relative when you are defining multiple inputs simultaneously. The link icon (
 ) appears next to the parameter that has been defined as a link to a cell.
Input Name: Enter a descriptive name for this input. The default is the name of the cell (e.g., B2).
Type Distribution: Choose the appropriate distribution for the input. See the list of Supported Distributions.
Fit from data: Let Quantum XL detect distribution based on existing data.
Parameters such as Mean and Standard Deviation: Each distribution has unique parameter names. For example, the Normal distribution has the parameters Mean and Standard Deviation.
Input is a Noise: Inputs that have this property checked will not be displayed during optimization.
Custom Distributions: You can add a new Custom Distribution or edit an existing one. The button 'Edit Current Custom Distribution' becomes available when the selected distribution from the drop down menu is a Custom Distribution.
Input Browser: Provides the ability to edit the next or previous input in the worksheet, without having to close the dialog.
Advanced Tab
The advanced tab allows you to define the optimization range, valid range, and plot range for the input. The optimization range defines the low and high values within which this input can search during optimization. For example, if you enter 10 for the Optimization Low and 20 for the Optimization High, then Quantum XL will only search in the range 10 to 20 during optimization.
The Valid range defines the valid range for this input. If you enter ranges outside the valid range, an error message is displayed.
The Plot Range defines the range for latitude plots.
Marking Outputs
To mark a cell as an output, either right click on the cell and select "Mark Output" or click on the Mark Output icon on the shortcut bar. Note: the cell that is being marked as an output must be in the form of an equation (e.g., =F6). You will then be prompted with the following options.
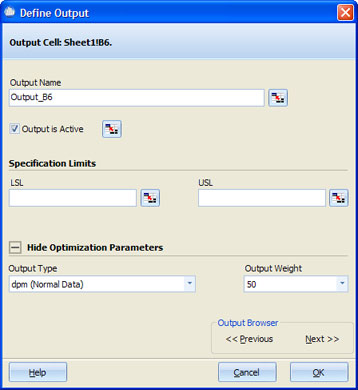
Output Name: Enter a name for this output.
Output is Active: If checked, it indicates that the results of the output will be shown during an EVA.
Specification Limits: Enter the Lower Specification Limit (LSL) or the Upper Specification Limit (USL) for this output. Both are optional; however, at least one is required to calculate quality statistics (defects per million and Cpk).
Output Browser: Provides the ability to edit the next or the previous output in the worksheet, without having to close the dialog.
Optimization Parameters
Output Type: Can be either "dpm (Normal Data)" or "Count Out of Spec (Non-normal data)". If set to dpm, during optimization Quantum XL will calculate the dpm using a normal approximation by calculating the mean and standard deviation, and then integrating the area outside of the specification. If set to "Count Out of Spec", during optimization Quantum XL will calculate the dpm by counting the number of simulations outside of the specification limits. The recommended approach is to leave the optimization set to "dpm" unless the output has a shape that is significantly not normal. An output that is technically not normal but still in the general form of the Normal distribution will usually optimize best using dpm. If the distribution is highly skewed, then consider "Count Out of Spec". If you are uncertain, optimize the model first using dpm and then using "Count of Out of Spec" and see which one works better for you.
Output Weight: If optimizing more than one output, the optimization weight allows you to indicate which output is more important. An output with a weight of 100 will be twice as important as one with a weight of 50.
Note
When you start the optimization process, you will be given the option to change the type and weight for each output.