Home / Statistical Tools / Hypothesis Tests / Attribute Tests / Chi-Square
Contingency Table (Chi-Squared test for independence)
From Excel click...
QXL Stat Tools Tab > Hypothesis Tests > Attribute Tests > Contingency Table/p >
| Test type: | Relation |
|---|---|
| Data: | Qualitative |
| Number of Variables: | 2 |
| Number of Groups: | 2 or more |
| Assumptions: | All expected counts are > 1 and no more than 20% of expected counts are less than 5 |
The Chi-Squared test is a hypothesis test for independence between two variables.
Data has been classified by two categorical variables and organized in the contingency table.
Hypothesis tested:
| H0 : | Categorical variables are independent of each other. |
|---|---|
| H1 : | Categorical variables are related. |
Step #1: Select data source for the Chi-Squared test.
Data for the Chi-Squared test can come from an Excel spreadsheet or SQL data source.
See source data formats and example data for the Chi-Squared test.
Step #2: Options.
-
'Decision Criteria' option (default = 0.05). The value of the decision criteria (significance or α level).
-
'Display mode' option. When the 'Verbose (long)' option is on, Quantum XL will display additional text that explains the hypothesis test results.
Example
We are interested in whether the employment status of voters is related to preferences toward some political candidates.
-
Run Quantum XL > Hypothesis Tests > Attribute tests > Contingency Table.
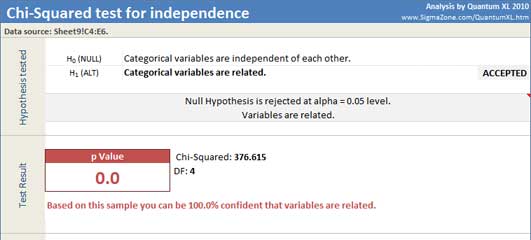
Quantum XL will display Chi-Squared statistic, degrees of freedom, p Value and tabulated statistics.
Since the p-Value in this example (p-Value = 10-16) is less than the decision criteria (0.05), the null hypothesis can be rejected. We can draw the conclusion that the variables are related.
Update
Chi-Squared test is updatable. After you create analysis, you can change its data source or add new data to the data source and simply update the analysis.
-
Update: Quantum XL > Statistical Tools > Update Sheet
-
Change settings: Quantum XL > Statistical Tools > Modify Chart/Analysis