Home / Statistical Tools / Hypothesis Tests / Tests For Median / One-sample Sign
1-sample sign test
From Excel click...
QXL Stat Tools Tab > Hypothesis Tests > Tests for Median > 1-Sample Sign
| Test type: | Median |
|---|---|
| Data: | Quantitative |
| Number of Variables: | 1 |
| Number of Groups: | 1 |
| Assumptions: | One sample from continuous distribution |
The 1-sample sign test is a hypothesis test for the significance of the difference between the population median and a hypothesized value. It assumes that data comes from continuous distribution. The distribution doesn't have to be either normal or symmetric. If the data is symmetric, the 1-sample Wilcoxon is more powerful.
Hypothesis tested:
| H0 : | Median = Median0 |
|---|---|
| H1 : | Median ≠ Median0 |
where Median is the population median, and Median0 is the hypothesized median.
Step #1: Select data source for sign test.
Data for the 1-sample sign test can come from an Excel spreadsheet or SQL data source.
See source data formats and example data for the 1-sample sign test.
Step #2: Options.
-
Standard options
- 'Not equal to' option. Select this option to run a two tailed test. The null hypothesis is that the population median and hypothesized median are equal.
- 'Less Than' option. Select this option to run a lower tailed test. The alternative hypothesis is that the population median is smaller than the hypothesized median.
- 'Greater Than' option. Select this option to run an upper tailed test. The alternative hypothesis is that the population median is greater than the hypothesized median.
- 'Hypothesized median'. The value of the hypothesized median.
-
Advanced options
- 'Decision Criteria' option (default = 0.05). The value of the decision criteria (significance or α level).
- 'Display mode' option. When the 'Verbose (long)' option is on, Quantum XL will display additional text that explains the hypothesis test results.
Example
-
Open 1-sample sign worksheet.
-
Run Quantum XL > Hypothesis Tests > Tests for Median > 1-Sample Sign.
-
In the Options dialog, select 'Not equal to' test, and enter 1.9 for the hypothesized median.
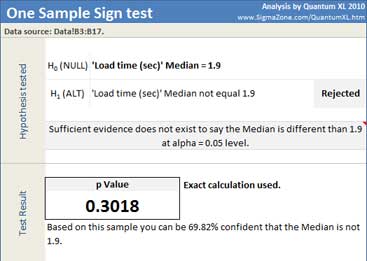
Quantum XL will display dataset statistics and p Value. If the number of observations is greater than 50, normal approximation is used to calculate the p-Value. Otherwise, Quantum XL will use exact method (binomial distribution).
In this example, a p-Value of 0.3018 is greater than the decision criteria (0.05), so the null hypothesis cannot be rejected. We cannot conclude that the population median is not equal to 1.9.
Quantum XL also displays 95% confidence interval for the median.
Update
The 1-sample sign test is updatable. After you create an analysis, you can change its data source or add new data to the data source and simply update the analysis.
-
Update: Quantum XL > Statistical Tools > Update Sheet
-
Change settings: Quantum XL > Statistical Tools > Modify Chart/Analysis