Home / Statistical Tools / Hypothesis Tests / Tests For Mean / Two-sample t-Test
Two-sample t-Test
From Excel click...
QXL Stat Tools Tab > Hypothesis Tests > Tests for Mean > Two-sample t-Test
| Test type: | Mean |
|---|---|
| Data: | Quantitative |
| Number of Variables: | 1 |
| Number of Groups: | 2 |
| Assumptions: | Two independent, normally distributed samples |
The two-sample t-Test is a hypothesis test for the significance of the difference between the two populations means. It assumes that two samples come from independent populations and that they are normally distributed. If the data is not normally distributed, use the Mood's Median or Kruskal-Wallis test instead. If samples are dependent (paired), use the paired t-Test.
Hypothesis tested:
| H0 : | μ1 − μ2 = δ0 |
|---|---|
| H1 : | μ1 − μ2 ≠ δ0 |
where μ1 and μ2 are the populations' means, and δ0 is the hypothesized difference between two means.
Step #1: Select data source for t-Test.
Data for the two-sample t-Test can come from an Excel spreadsheet, SQL data source, or it can be entered manually.
See source data formats and example data for the two-sample t-Test.
Step #2: Options.
-
Standard options
- 'Not equal to' option. Select this option to run a two tailed t-test. The null hypothesis is that the means are equal.
- 'Less Than' option. Select this option to run a lower tailed t-test. The alternative hypothesis is that the mean of the first dataset is smaller than the mean of the second dataset.
- 'Greater Than' option. Select this option to run an upper tailed t-test. The alternative hypothesis is that the mean of the first dataset is greater than the mean of the second dataset.
- 'Difference'. The null hypothesis value. It represents a difference in dataset means (Dataset 1 Mean - Dataset 2 Mean). The default value is zero, which means that the dataset means are equal.
-
Advanced options
- 'Decision Criteria' option (default = 0.05). The value of the decision criteria (significance or α level).
- 'Assume equal variance' option. If this option is checked, the t-test will be performed assuming that the populations have equal variances (a pooled variance will be used). Uncheck this option if populations do not have equal variances.
- 'Charts' options. Display box plot and dot plot along with hypothesis results.
- 'Display mode' option. When the 'Verbose (long)' option is on, Quantum XL will display additional text that explains hypothesis test results.
Example
-
Run Quantum XL > Hypothesis Tests > Tests for Mean > Two-sample t-Test.
-
In the Standard Options dialog, select 'Not equal to' test.
-
In the Advanced Options dialog, check 'Assume equal variance' option because two samples in this example have equal variance. You can check for variance equality by running F-Test.
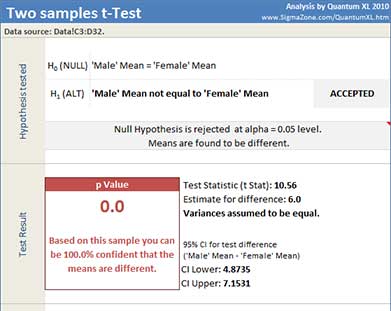
Quantum XL will display t-Test value, p Value, 95% confidence interval for difference between populations means, and dataset statistics.
In this example, the p-Value of 4*10-15 is less than the decision criteria (0.05) so the null hypothesis can be rejected. We can conclude that the means are different.
Update
The t-Test is updatable. After you create a t-Test analysis, you can change its data source or add new data to the data source and simply update the analysis.
-
Update: Quantum XL > Statistical Tools > Update Sheet
-
Change settings: Quantum XL > Statistical Tools > Modify Chart/Analysis