Home / Statistical Tools / Hypothesis Tests / Power And Sample Size / Power test for One proprtion test
Power and sample size for One proportion test
From Excel click...
QXL Stat Tools Tab > Hypothesis tests > Power and Sample Size > One proportion test
This test is used to perform power and sample size analysis for one proportion test.
Step #1 -- What to calculate
Quantum XL can calculate one of the following parameters, when the other two are provided:
- Sample size.
- Power of the test.
- Comparison proportion that will be compared to hypothesized proportion (effect size).
Step #2 -- Provide known parameters

After telling Quantum XL what to calculate you need to provide the other two parameters. For example, if you are interested in sample size, you will have to provide Power of the test and the Comparison proportion.
Parameters can be entered as a single value (default), or you can provide a range of values. In order to provide a range of values:
-
click at 'advanced input mode' button
-
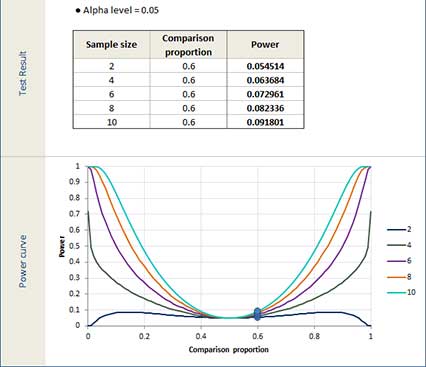
Enter 'From', 'To' and 'Step' values. Example: If you enter for sample size the following values, 'From'=2, 'To'=10 and 'Step'=2, Quantum XL will perform calculations for sample sizes 2, 4, 6, 8 and 10.
Quantum XL will report results for all combinations of the provided values. If you have provided 5 sample sizes and 2 comparison proportions , Quantum XL will report 10 power values. Maximum number of results is 100.
Limitations:
-
Minimum sample size is 2.
-
Power values must be greater than 0 and less than 1.
-
Comparison proportion must be greater than 0 and less than 1.
-
If sample size is being calculated, comparison proportion must be:
- not equal to hypothesized proportion for 'not equal' test.
- less than hypothesized proportion for 'less than' test.
- greater than hypothesized proportion for 'greater than' test.
Step #3 -- Hypothesized proportion
Enter the hypothesized proportion (value greater than 0 and less than 1).
Step #4 -- Alternative hypothesis
'Advanced options' tab allows you to select between one sided and two sided tests.
- Not Equal. Perform two sided test. Alternative hypothesis is that Proportion is not equal to hypothesized proportion.
- Less than. Perform lower-tailed test. Alternative hypothesis is that the Proportion is < hypothesized proportion.
- Greater than. Perform upper-tailed test. Alternative hypothesis is that the Proportion is > hypothesized proportion.
Step #5 -- Alpha level (decision criteria)
Alpha level is a probability of committing type I error. The greater the value, the greater the power of test.
Default value is 0.05.
OUTPUT
Quantum XL will report results for all combinations of the provided values. Report includes table with Sample Size, Comparison proportion, Power and Actual power values, and a power curve. The power curve graph has Comparison proportion on the X-Axis and Power on the Y-Axis. One curve is plotted per sample size.