Home / Monte Carlo / Latitude Plots / Latitude Plots
Latitude Plots
From Excel click...
QXL Monte Carlo Tab > Contribution Tools > Latitude Plot
Please read this article for more information on Latitude Plots.
Step #1. Define the lows and highs for the input variables
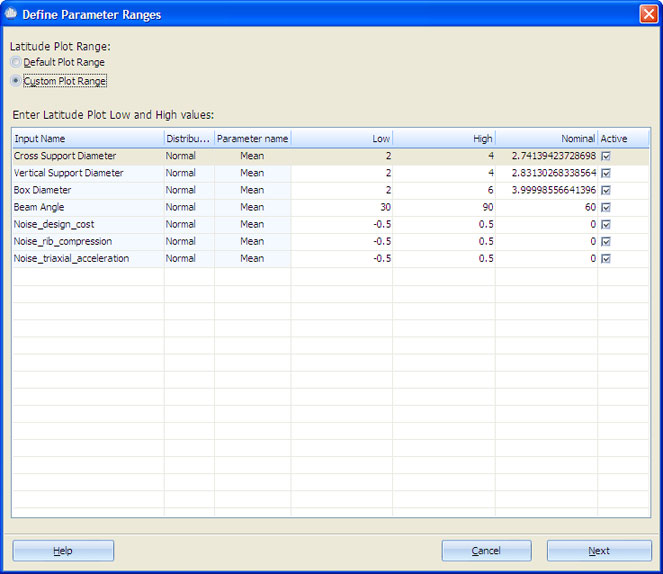
Enter low and high values for distribution-specific parameters. See Supported Distributions for more information.
You can use the default plot range or define a custom plot range for each input by checking the appropriate option. Uncheck each input you do not need in the report. All inputs are checked by default.
Step #2: Customize the plot appearance
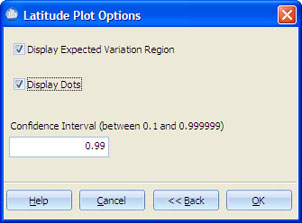
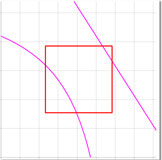
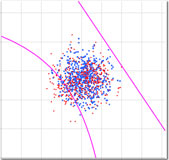
The plot is composed of three parts: the dots, the rectangle (variation region) and the contour lines. You can choose whether or not to display the dots and the variation region. The confidence interval input box will be enabled if the 'Display Expected Variation region' option is checked.
| Display Expected Variation Region option checked | Display Dots option checked |
|---|---|
 |
 |