Home / Statistical Tools / Distribution Fit/Calc / Distribution Calculator / Geometric Distribution
Geometric Distribution
Probability Calculator
From Excel click...
QXL Stat Tools Tab > Distribution Fit/Calc > Distribution Calculator > Geometric
The Geometric distribution is a discrete probability distribution. The Geometric distribution is used when there are exactly two possible outcomes from a Bernoulli trial. These two outcomes are typically labeled "Success" and "Failure". Some texts use "Event" and "Non-Event". The Geometric distribution provides the probability of observing x trials before thefirstsuccess.
Using the Calculator
Step 1
Enter the p, the probability of success, and x (optional).
Step 2
Quantum XL will plot the probability for the relevant X values.
If X was supplied:
-
The bar corresponding to X will be red.
-
At the bottom of the report, Quantum XL will provide the numeric results for X being less than, less than or equal to, greater than, greater than or equal to, and equal to.
Example
A newlywed couple in the United States is family planning. The mother's name is Katherine. She is the 5th generation of consecutive Katherine's in her family lineage and would like to pass the name to her child. The couple would like to know how many children they will need to have before they have a girl.
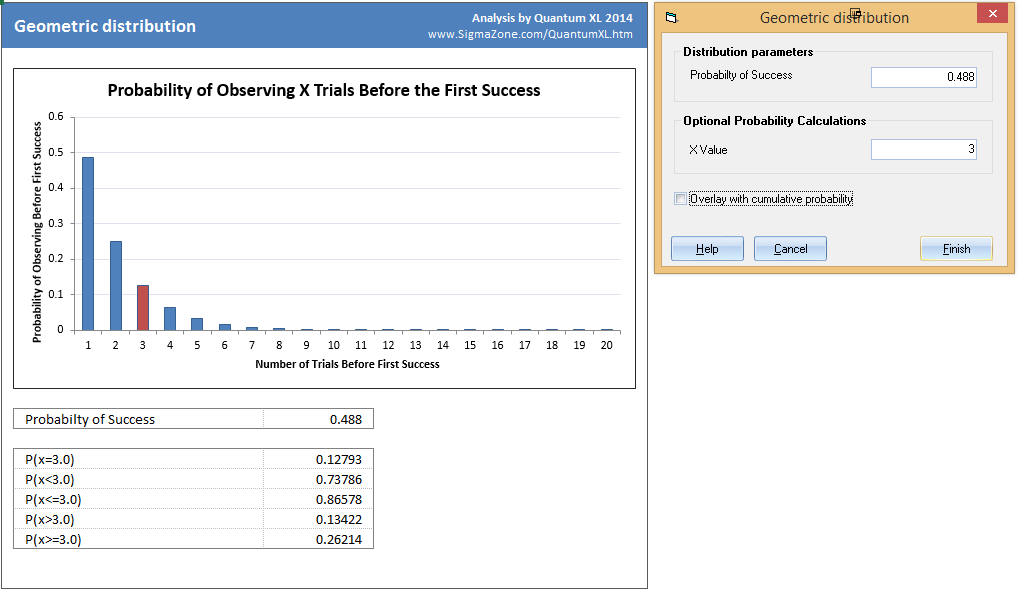
According to the CIA factbook, the probability of a child being born male in the United States is 51.2%, thus the odds of being born female are 48.8%. Since the mother would like a girl, we shall define "success" as a female child. Thus, p = .488. The couple doesn't think they can afford more than 3 children, so they are interested in the probabilities of having a girl by the third child.
Remember that the Geometric distribution provides the probability of observing x trials before the first success. If we restate this in the context of the problem, theGeometric distribution returns the probability of having x children (trials) before the first girl (success).
-
The bar at X=1, indicates the probability of having a girl on the first child is 48.8%.
-
The bar at X=2, indicates the probability of the first girl being the second child born is ~25%.
-
The bar at X=3, indicates the probability of the first girl being the third child born (two boys then a girl) is ~13%.
-
P(X=3), in the text results, gives us the exact probability of the first girl being the third child at 12.793%.
-
P(X<=3) is the probability that the first girl will occur by the third child and is ~87%.
-
P(X<=3) is also the sum of P(X=1), P(X=2), P(X=3).
-
P(X>3) is the probability that the first girl will occur after the third child and is ~13%.
Notes:
The birth ratio in the CIA factbook is under debate for various reasons. However, most countries do have more male children being born.
While more male children are being born, by the time the children are in the 25-54 age range, the ratio is 1 to 1.
The total population ratio is .97 males to each female (2014 estimate).