Home / Statistical Tools / Hypothesis Tests / Attribute Tests / Two proportion test
Two proportion test
From Excel click...
QXL Stat Tools Tab > Hypothesis Tests > Attribute Tests > Two proportion test
| Test type: | Proportion |
|---|---|
| Data: | Qualitative |
| Number of Variables: | 1 |
| Number of Groups: | 2 |
| Assumptions: | Two samples of Binomial (YES/NO) data |
The two proportion test is a hypothesis test for the significance of the difference between the two populations' proportions. Assumptions are:
-
Two data samples.
-
Sample consists of Binomial (YES/NO) data.
-
n1π1 > 5 and n1(1-π1) > 5 and n2π2 > 5 and n2(1-π2) > 5, where n1,2 are sample sizes, and π1,2 are population proportions.
-
Sample sizes do not have to be equal.
Hypothesis tested:
| H0 : | π1 = π2 |
|---|---|
| H1 : | π1 ≠ π2 |
where π is the population proportion.
Step #1: Select data source for two proportion test.
Data for two proportion test can come from an Excel spreadsheet, SQL data source, or it can be entered manually.
See source data formats and example data for the two proportion test.
Step #2: Options.
Standard options
-
'Not equal to' option. Select this option to run a two tailed test. The alternative hypothesis is that the populations' proportions are different.
-
'Less Than' option. Select this option to run a lower tailed test. The alternative hypothesis is that the proportion of the first dataset is smaller than the proportion of the second dataset.
-
'Greater Than' option. Select this option to run an upper tailed test. The alternative hypothesis is that the proportion of the first dataset is smaller than the proportion of the second dataset.
-
'Difference'. The null hypothesis value. It represents a difference in dataset proportions (Dataset 1 proportion-- Dataset 2 proportion). The default value is zero, which means that dataset proportions are equal.
Advanced options
-
'Decision Criteria' option (default = 0.05). The value of the decision criteria (significance or α level).
-
'Pooled proportion' option. Use the pooled estimate of proportion for the test.
-
'Display mode' option. When the 'Verbose (long)' option is on, Quantum XL will display additional text that explains the hypothesis test results.
Example
-
Run Quantum XL > Hypothesis Tests > Attribute tests > Two proportion test.
-
In the Options dialog, select 'Not equal to' test.
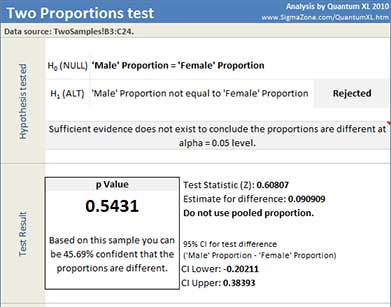
Quantum XL will display test statistic, estimate for difference, p Value, 95% confidence interval and dataset statistics.
In this example, p-Value of 0.5431 is greater than the decision criteria (0.05) so null hypothesis cannot be rejected. There is not enough evidence to say that the populations' proportions are different.
Update
The two proportion test is updatable. After you create the analysis, you can change its data source or add new data to the data source and simply update the analysis.
-
Update: Quantum XL > Statistical Tools > Update Sheet
-
Change settings: Quantum XL > Statistical Tools > Modify Chart/Analysis