Home / DOE / Additional Information / Type I and Type II Error
Understanding Type I and Type II (Power) Error in DOE
Typically, when choosing the number of replicates the "Power" of the design is impacted. Power is Beta or the probability of committing a Type II error.
Background on Power
The table below depicts the classic table when using a hypothesis test. The top of the table reflects the "True State of Nature" while the rows are the "Conclusion draw". If they match, then no error is made. However, if they don't match there is a possibility of two types of error.
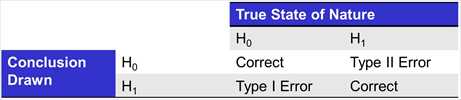
A "Type I" error, generally considered to be more egregious, is when you conclude the alternate hypothesis when in fact it is not true. Within the context of DOE, the probability of a Type I error is the p value in a regression output. In the example below, if we conclude that "Block" is significant we have a .0089 or .89% chance of making a Type I Error. Within the context of DOE, a Type I error is concluding a term is significant when in fact it is not.
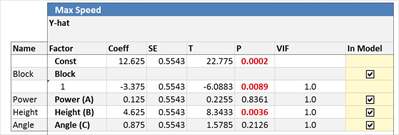
Most experiments use either .05 or .1 as their "threshold for significance", meaning that if their P value is less than .05 then they will consider the term significant. Quantum XL colors all P values less than or equal to .05 Red and colors P values greater than .05 but less than .1 Blue.
Type II Error is the other type of error that can be made. If we conclude that the term is not significant but it really is, then we have made a Type II error. While we don't get a P value for a Type II error, we directly affect this by choosing the number of replicates.
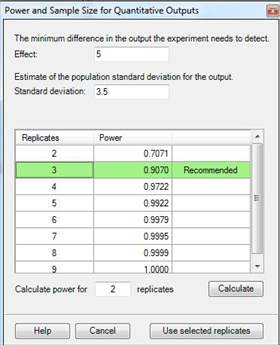
An increase in the number of replicates will result in more power, which reduces the probability of a Type II Error. For some types of DOEs, Quantum XL will provide the Power calculations for you when you click on the button below the number of replicates.
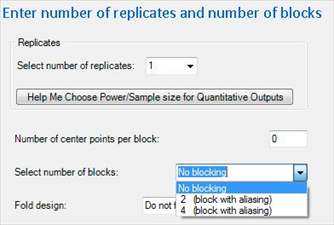
Exactly how many replicates are required will depend on the minimum difference you're trying to detect, the amount of variation in the output, the design you're using, and the number of blocks. The window that performs the calculation looks like the screen below. For more information see Power and Sample Size Calculation in DOE.