Home / Statistical Tools / Control Charts / ZMR Chart (Short Run Control Chart)
ZMR Chart (Short Run Control Chart)
From Excel click...
QXL Stat Tools Tab > Control Charts > ZMR Chart
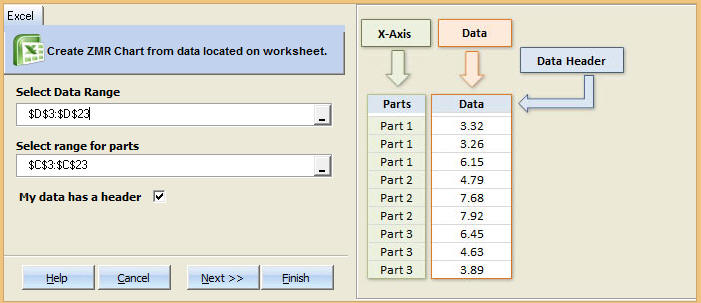
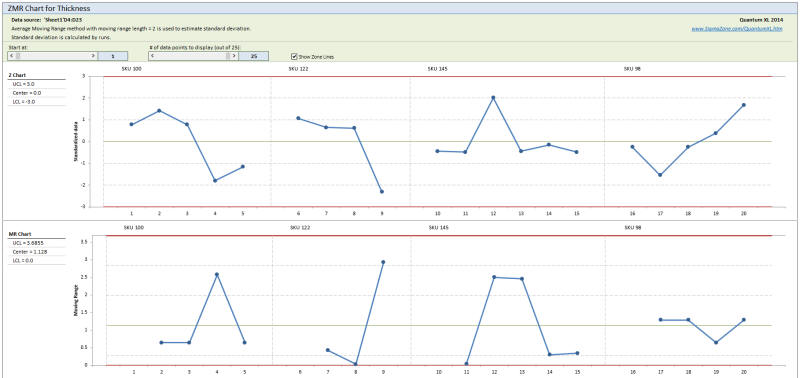
When there isn't sufficient data to create a control chart, the ZMR chart allows you to create a control chart by mixing different part types. Example: The dataset below represents the part thickness data for four different SKUs (Stock Keeping Units). Note that for SKU 100, we've made five parts; for SKU 122 we've made 4 different parts; etc. You can download this dataset here.
The Z chart will standardize the parts (see standardization options below) and monitor the process for out of control conditions.
Step 1: Prepare the Data for Analysis
The ZMR Chart has unique data requirements as compared to other control charts. There must be a column which separates the part types. In the dataset above, the column "Part Name" groups the parts into their respective runs. The column "Thickness" contains the data that will be plotted on the control chart.
Step 2: Select QXL Stat Tools Tab > Control Charts > ZMR Chart
Note that "Data Range" is for the data being plotted and "range for parts" distinguishes between groups.
Step 3: Options
Show OOC Points and Lines:Check on or off to display the respective lines
Control Limits
-Group by Parts:The standardization of the parts is done using the pooled standard deviation resulting in each part having a unique estimate for sigma.
-Group by runs:The data is divided into runs at which Rbar/d2 is used to estimate the standard deviation.
-Constant:The moving range is calculated from the part standardization. The standard deviation is based on Rbar/d2 where Rbar comes from the moving range. The data is standardized using the resulting sigma.
-Relative to Size:Calculation is identical to Constant method, except that the natural log is taken prior to calculations.
-Number of standard deviations: The control limits are placed at +/-- Num_Standard_Deviations*sigma. The default is 3.
Estimate Standard Deviation Method (Advanced Options)
-Average Moving Range:The range is calculated for each group, the standard deviation is estimated by Average_Range/d2 where d2 is a Shewhart constant.
-Median Moving Range:The median is calculated for each group, the standard deviation is estimated using median_range/d4 where d4 is a Shewhart constant.
-Moving Run Length:The number of consecutive parts used to calculate the run length. The default is 2.
See Also