Home / Statistical Tools / Control Charts / Out-of-Control tests
Out-of-Control tests
From Excel click...
QXL Stat Tools Tab > Control Charts
These tests detect a specific pattern of the data plotted on a Control Chart. Each pattern suggests the presence of a special cause of the process variation.
You can select in the options which tests should be run by Quantum XL.
Test #1
A point that exceeds control limits (more than 3 standard deviations from the center line).
This test is applicable for all Control Charts.
Test #2
9 consecutive points on the same side of the center line.
This test is applicable for all Control Charts.
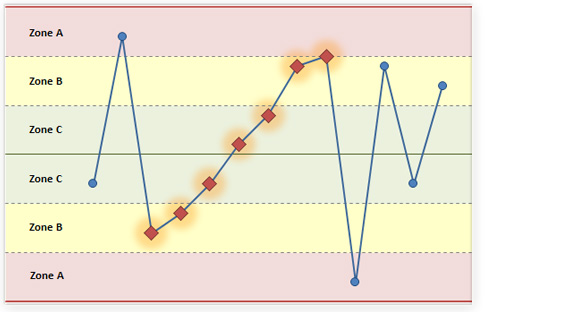
Test #3
6 consecutive points, all increasing or all decreasing.
This test is applicable for all Control Charts.
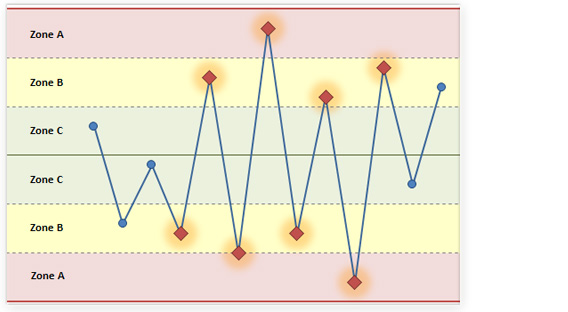
Test #4
14 consecutive points alternating up and down.
This test is applicable for all Control Charts.
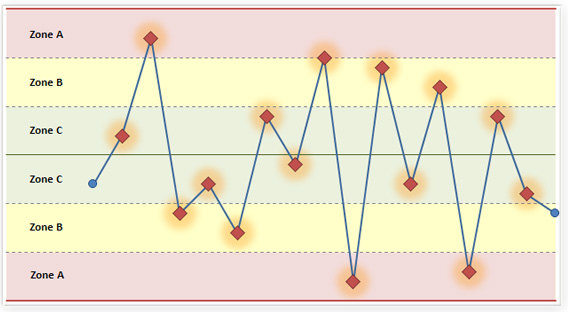
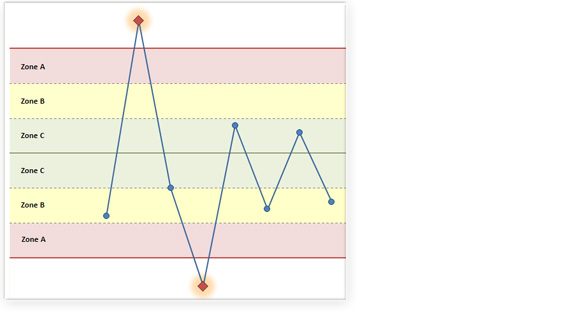
Test #5
2 out of 3 points in the zone A (> 2 Standard Deviations from the center line).
This test is applicable for the Xbar chart and the Individuals chart.
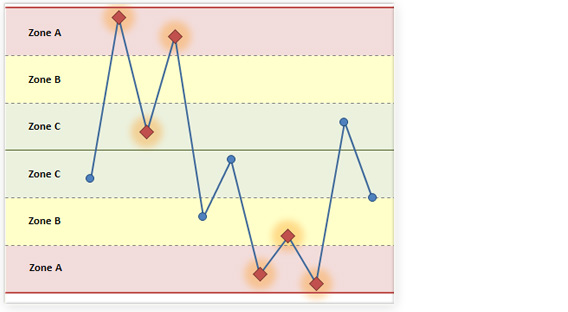
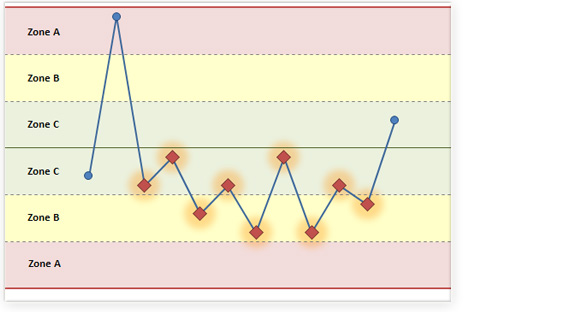
Test #6
4 out of 5 points in the zone B (> 1 Standard Deviations from the center line on the same side).
This test is applicable for the Xbar chart and the Individuals chart.
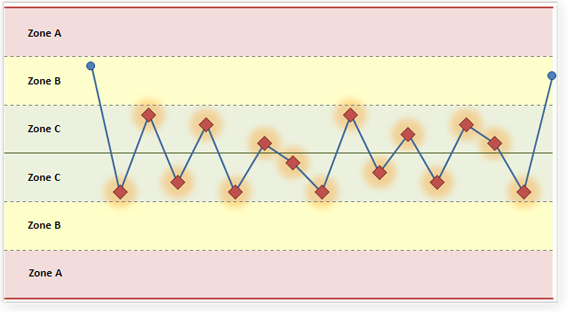
Test #7
15 consecutive points in the Zone C (within 1 Standard Deviation from the center line, either side).
This test is applicable for the Xbar chart and the Individuals chart.
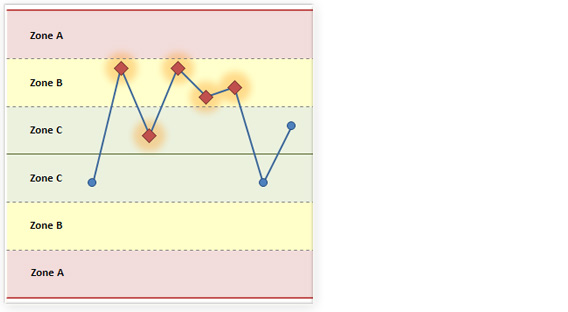
Test #8
8 consecutive points > 1 Standard Deviation from the center line on either side.
This test is applicable for the Xbar chart and the Individuals chart.