Home / Statistical Tools / Control Charts / Control Charts Scrolling
Scrolling Control Charts
After the Control Chart has been created, you can customize how many data points are displayed and whether to display Zone Lines and Out-of-Control points or not. Charts are created in such a way that they do not require Quantum XL running for these customizations. You can share your control charts with users who do not have Quantum XL installed, and they will be able to scroll Control Charts.
Sliders and check boxes have no effect on the results whatsoever.
-
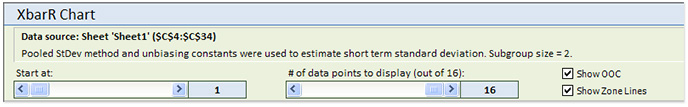
Slider 'Start at'. Controls from which data point the Control Chart starts displaying data.
-
Slider '# of data points to display'. Controls how many data points should be plotted on the chart(s).
-
Check box 'Show OOC'. Use it to show or hide Out-of-Control points. This check box is not visible if there are no OOC points.
-
Check box 'Show Zone Lines'. Use it to show or hide Zone Lines.
The maximum number of data points control charts can display is 10,000. By default, the Control Chart will try to display the last 1,000 data points, or all data points, depending on which one is smaller.