Home / Monte Carlo / Model Building / EVA Overlaid Histograms
EVA Overlaid Histograms
From Excel click...
QXL Monte Carlo Tab > Run > Set up Histogram Groups
The expected value analysis includes a worksheet with expected value statistics and a histogram for each output. In addition to histogram per output, you can display multiple outputs overlaid on a single chart.
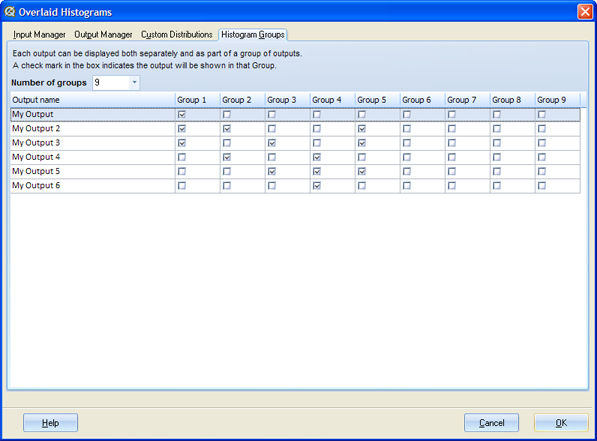
In order to display overlaid histograms you must define output groups.
Go to 'Quantum XL >Expected Value (Run) > Set up HistogramGroups' and assign each output to a group or groups. Outputs that belong to the same group will be plotted on the same chart.
Notes
-
Outputs that belong to the same group should have identical specification limits (LSL and USL). If they have different specification limits, Quantum XL will display a warning message and will disable the spec limits.
-
Group settings take precedence over an output's 'Active' setting. If an output is not set to active but it is part of a group of outputs, it will be plotted on an overlaid chart.
-
'Set up HistogramGroups' user interface is also available at Quantum XL >IO Manager.