Home / DOE / Charts / Main Effects Plots
Main Effects Plots
From Excel click...
QXL DOE Tab > Charts > Main Effects Plot
Create main effects plots from either a DOE Design sheet or a regression model by selecting QXL DOE Tab > Charts > Main Effects Plot.
Main effects plots are a graphical representation in the change of the output for each level in the input. The main effects plot below is for a DOE with three 2-level factors. Note that the dotted line for Vendor indicates the variable is categorical.
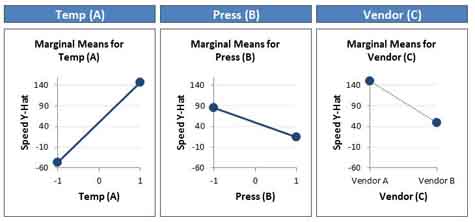
Quantum XL will create main effects plots with the same scale for each input so that the magnitude of the inputs can be compared with the each other.
Source
Main effects plots can be made from a regression model or a DOE Design Sheet. For more information about the differences between these two sources, see the topic Chart Source: Regression Model or Raw Design Data.
Create Multiple Charts
Check each input you would like to plot. If the source is a regression model, then you can change the set point and range for each variable.
-
Set Point: When plotting two variables the regression model will need a value for all terms that aren't in the plot. For example, if a model has the terms A, B, and C, when plotting A, B and C must be assigned a value. The set point allows you to set this value for other terms when plotting.
-
Range: The default range for each plot is the range of the DOE.