Home / Statistical Tools / MSA / MSA XbarR
XbarR Method
From Excel click...
QXL Stat Tools Tab > MSA (Gage R&R) > XbarR Method
Data source
The data source for XbarR analysis can be in the form of an MSA Template or in a stacked data format. Specification limits and reference values are optional. If specification limits are provided, the Gage Capability Curve will be plotted on the results sheet, and the Gage R&R table will have an additional column, ''% Tolerance'. Reference values are needed for the Bias and Linearity calculation.
Results
Stats Advisor
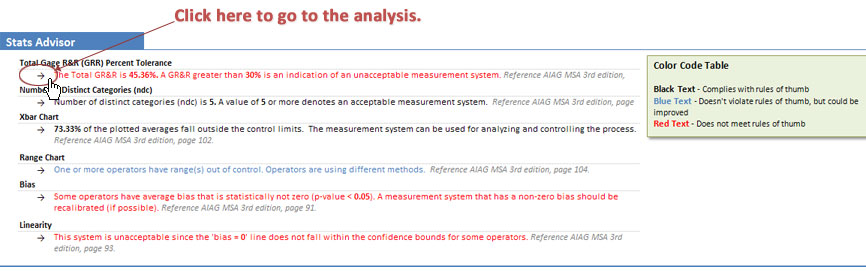
The purpose of Stats Advisor is to help users to understand numerical and graphical results of the MSA analysis.
Sentences are color coded with black text denoting results that comply with rules of thumb, blue text denoting results that doesn't violate rules of thumb but could be improved, and a red text for the results that does not meet rules of thumb.
Arrows on the left side of the sentences are links to the appropriate analysis result.
Gage R&R Results table
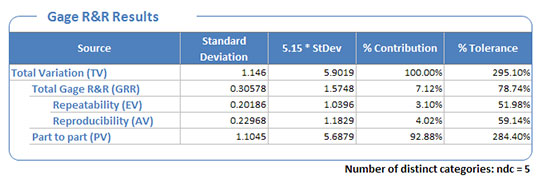
The MSA determines how much the variation within the measurement process contributes to overall process variability, and breaks the overall variability into the following statistics which are reported in the Gage R&R Table:
-
Equipment Variation (EV) -- Repeatability
-
Operator (appraiser) Variation (AV) -- Reproducibility
-
Repeatability & Reproducibility (GRR)
-
Part Variation (PV)
(Note that the XbarR method doesn't display the operator by part (interaction) component of variation. This component is reported by the ANOVA method.)
Xbar chart
Xbar Chart is used for comparison of operators to each other and to the mean. The measurement system can be used for analyzing and controlling the process if 50% or more of the plotted averages fall outside the control limits.
Range Chart
Range Chart is used for comparison of the operators' variation to each other. If all ranges are in control, then the appraisers are doing the same job. If one or more operators have range(s) out of control, then the operators are using a different method. If all operators have range(s) out of control, the measurement system is sensitive to appraiser technique and should be improved.
Components of Variation Chart
Graphically represents components of variation -- %Contribution and %Tolerance for Gage R&R, Repeatability, Reproducibility and Part to Part variation.
Operator by Part Chart
Graphically represents relationship between operator and part.
Gage Performance Curve Chart
Plots the probability of accepting/rejecting a part based upon its value. The Gage Performance Curve will only be created if specification limits are provided. If reference values have been provided, Gage Performance curve will be offset for the value of the average Bias.
Linearity and Bias section
Quantum XL will include Bias and Linearity analysis at the end of the MSA report, if the reference values have been provided. Bias and Linearity and Bias are calculated and reported per operator.