Home / Statistical Tools / Hypothesis Tests / Normality test
Normality Test
From Excel click...
QXL Stat Tools Tab > Hypothesis Tests > Normality test
| Test type: | Normality |
|---|---|
| Data: | Quantitative |
| Number of Variables: | 1 |
| Number of Groups: | 1 |
Many hypothesis tests assume that data is normally distributed. You can test if data is normal using the Normality test.
Hypothesis tested:
| H0 : | Data is normal. |
|---|---|
| H1 : | Data is not normal. |
Step #1: Select data source for the Normality test.
Data for the Normality test can come from an Excel spreadsheet or SQL data source.
See source data formats and example data for the Normality test.
Step #2: Options.
-
'Method' options. Quantum XL can run Anderson"“Darling (default), Shapiro"“Wilk or Kolmogorov"“Smirnov test for normality.
-
'Decision Criteria' option (default = 0.05). The value of the decision criteria (significance or α level).
-
'Display mode' option. When the 'Verbose (long)' option is on, Quantum XL will display additional text that explains the hypothesis test results.
Example
-
Open Normality test worksheet.
-
Run Quantum XL > Hypothesis Tests > Normality test.
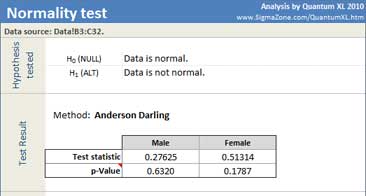
Quantum XL will display the test statistic, p Value and probability plot.
The p-Value represents the probability of falsely concluding that the data is not from the Normal distribution. In this example, p-Values for both datasets are greater than the decision criteria (0.05), so we cannot reject the null hypothesis. We do not have enough evidence to say that data is not normal.
Update
Normality test is updatable. After you create the analysis, you can change its data source or add new data to the data source and simply update the analysis.
-
Update: Quantum XL > Statistical Tools > Update Sheet
-
Change settings: Quantum XL > Statistical Tools > Modify Chart/Analysis